Understanding Dashboard
The Onion Dashboard provides a centralized overview of testing progress, assigned work, and recent activity.
This section explains each dashboard component to help you monitor and manage testing activities efficiently.
Complete Dashboard View
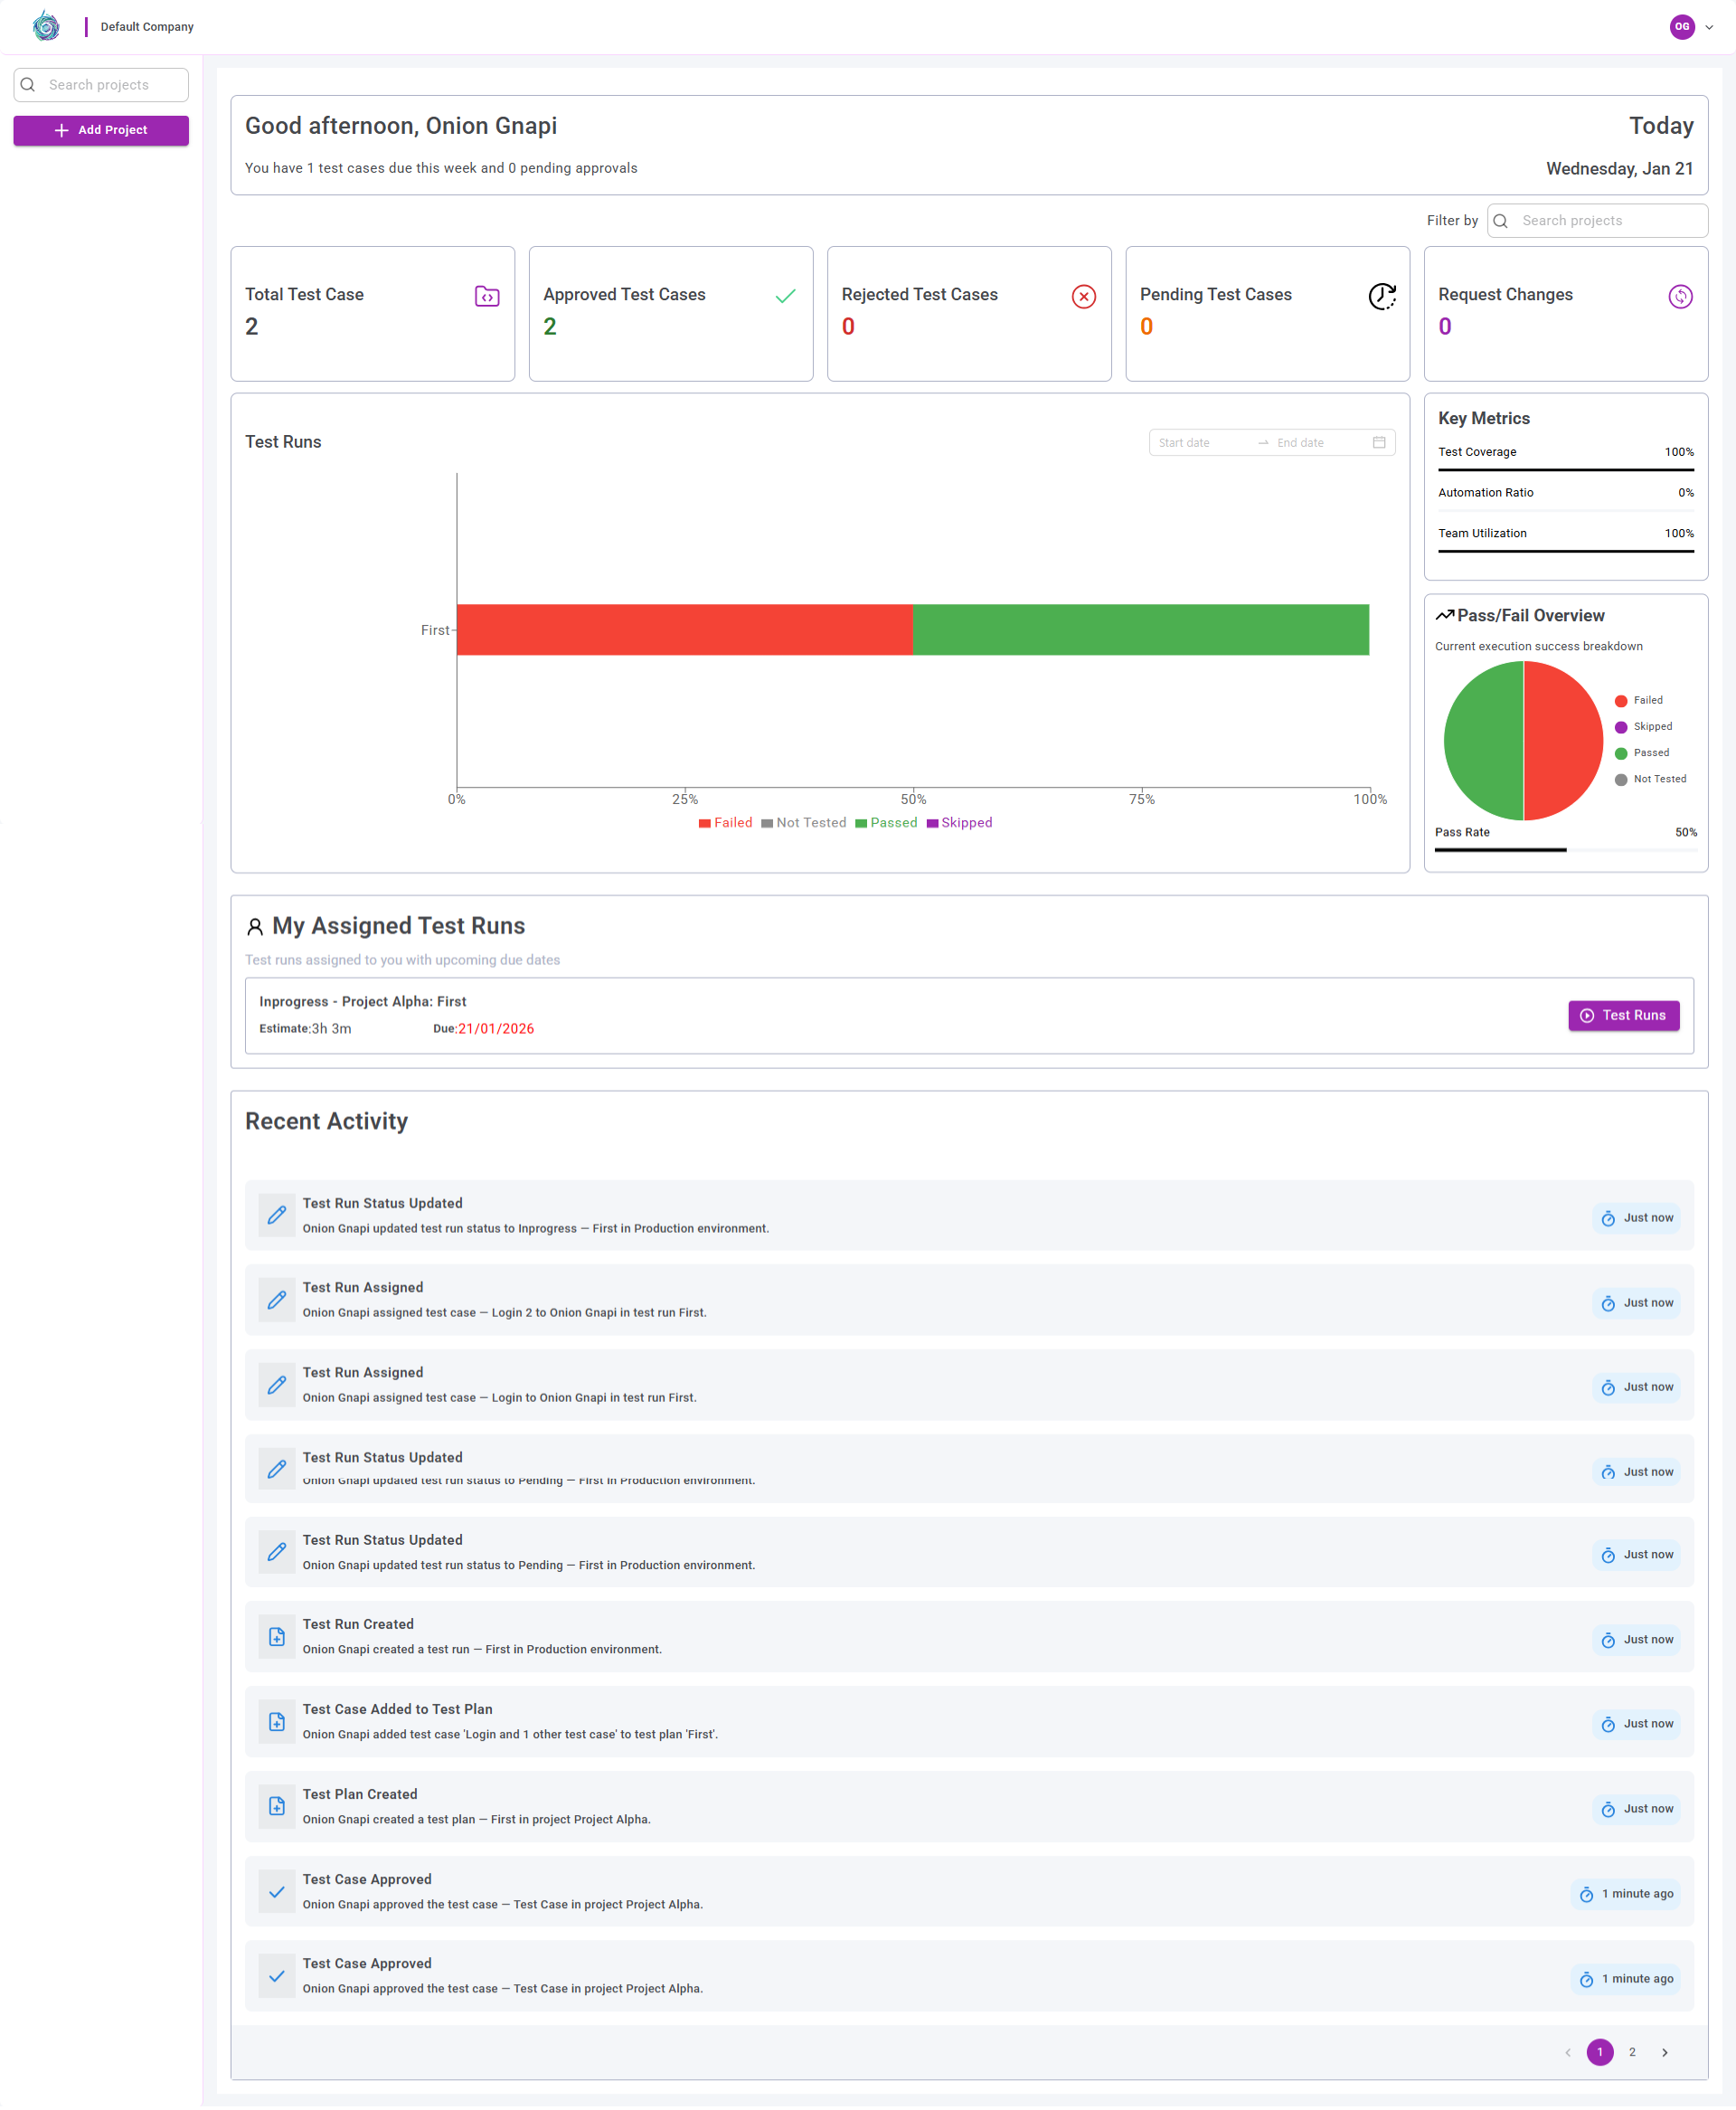
Dashboard Components Overview
The table below describes the main components available on the dashboard:
| Component | Description |
|---|---|
| Welcome Overview | Displays a personalized greeting and a summary of pending test cases |
| Test Case Summary Cards | Show high-level statistics for all test cases in the project |
| Test Runs Overview | Provides a visual summary of recent test run executions |
| Key Metrics | Displays essential quality metrics such as test coverage, automation ratio, and team utilization |
| Pass/Fail Overview | Shows execution success and failure distribution across test runs |
| My Assigned Test Runs | Lists test runs assigned to the current user with due dates and time estimates |
| Recent Logs | Displays a timeline of recent project activities and updates |
Detailed Component Breakdown
The following sections describe each dashboard component in detail.
1. Welcome Overview

This section displays a personalized greeting along with counts of pending test cases and approval activities for the current week.
2. Test Case Summary Cards

These cards provide a high-level overview of test case metrics, including:
- Total test cases
- Approved test cases
- Rejected test cases
- Pending approvals
- Change requests
They allow users to quickly assess the overall test case status of the project.
3. Test Runs Overview
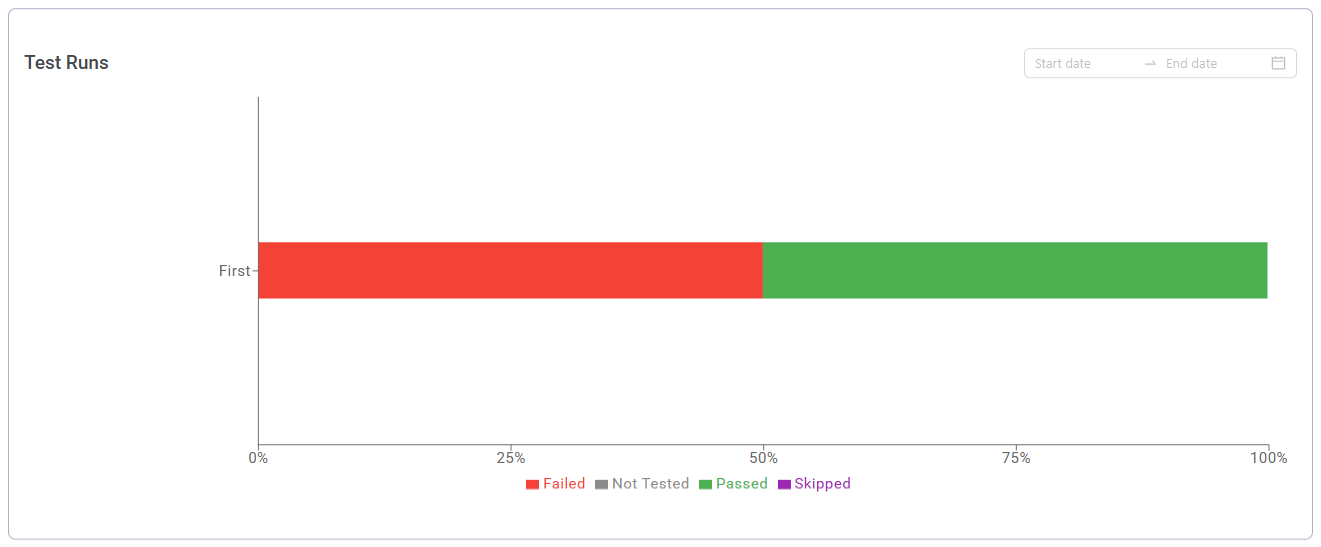
This section presents a visual summary of recent test run executions, including:
- Pass
- Fail
- Skip
- Not Tested
It helps assess the overall health of test execution across environments.
4. Key Metrics
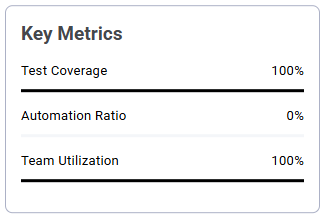
The Key Metrics section highlights critical quality indicators:
- Test Coverage
- Automation Ratio
- Team Utilization
These metrics help teams evaluate testing effectiveness and resource usage.
5. Pass/Fail Overview
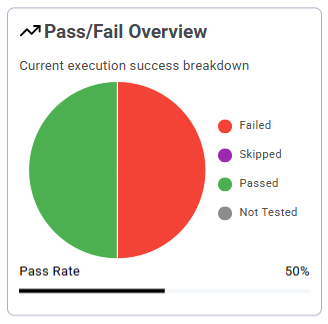
This section displays execution results using a pie chart, along with the overall pass rate, providing a quick view of test execution outcomes.
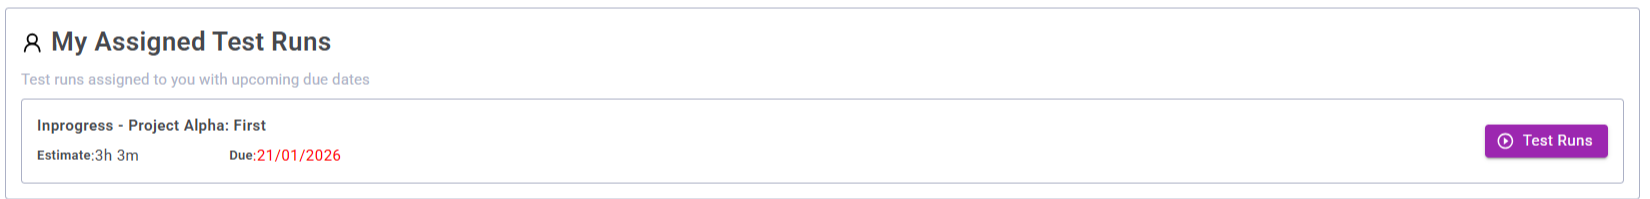
This section lists all test runs assigned to the current user, including:
- Test run name
- Estimated execution time
- Due date
- Quick navigation to the execution screen
7. Recent Logs
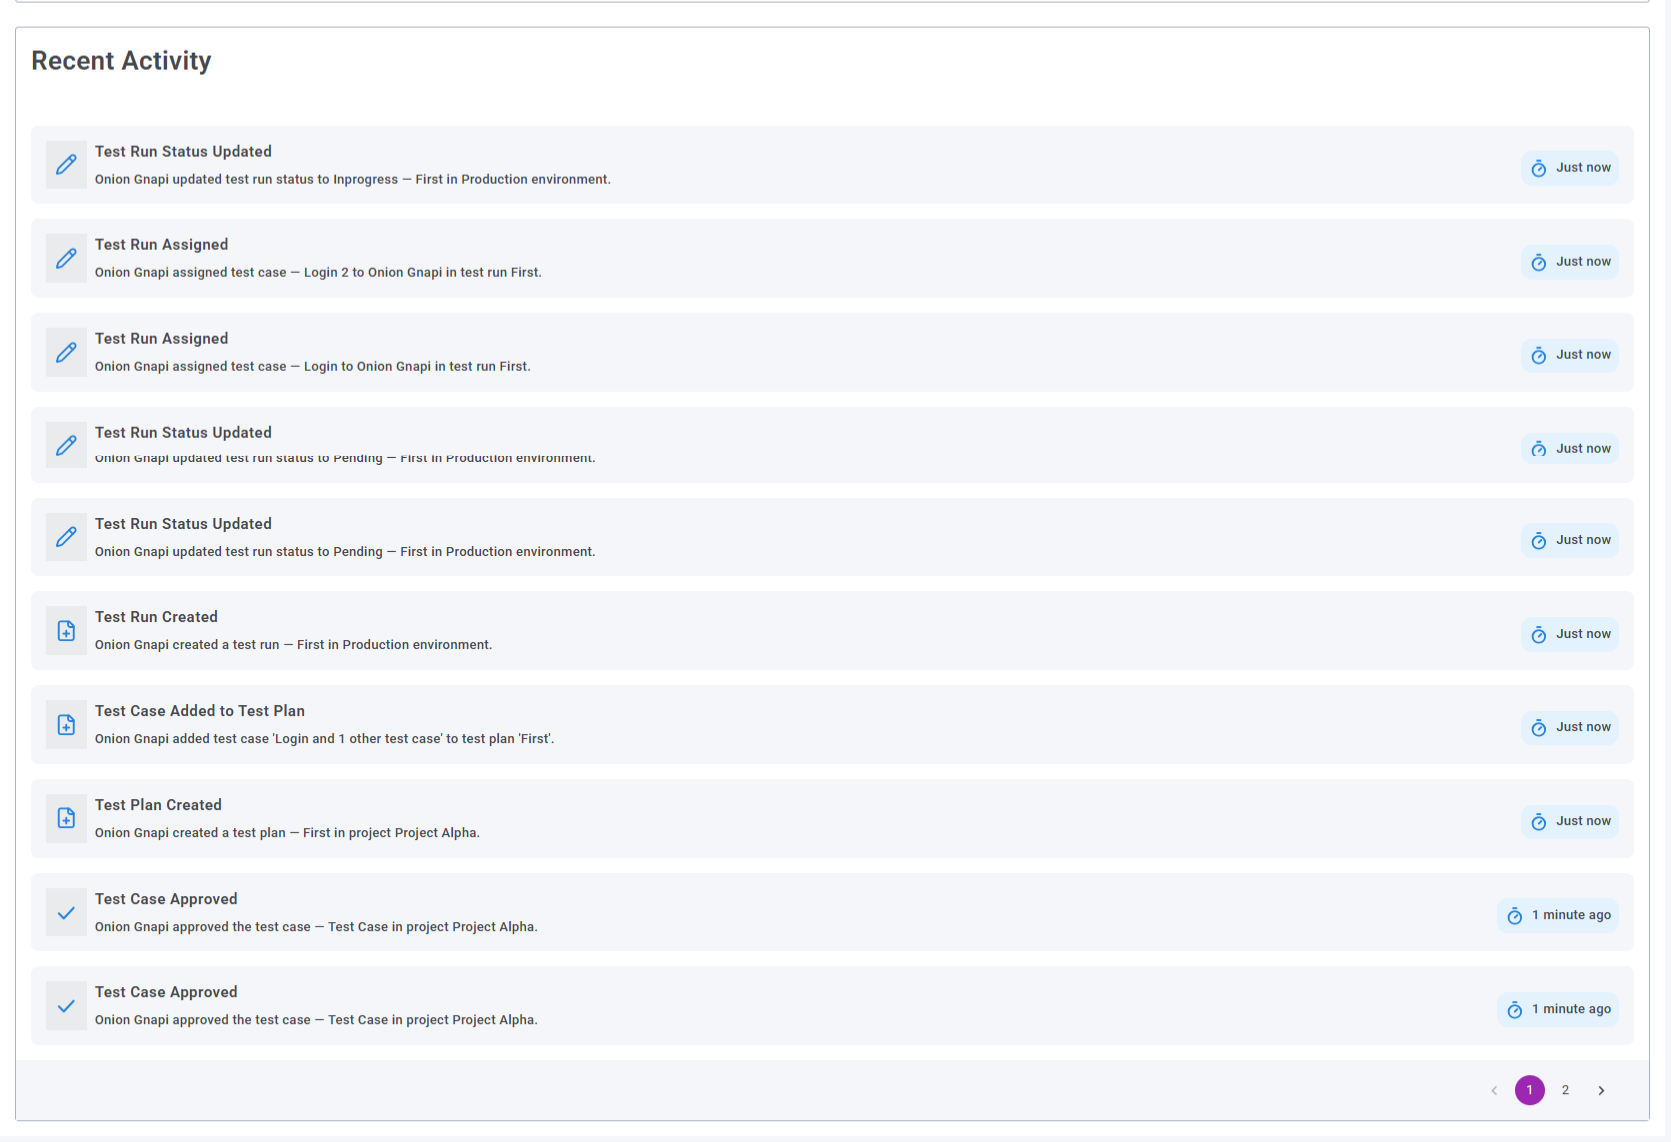
The Recent Logs section provides a chronological view of recent project activity, including:
- Test run status updates
- Test run re-executions
- User actions
- Environment-specific events